Data Commons for Food Security Organizations
Food security organizations are weighing in and sharing the information they need to bolster their reach and measure their impact. Read on to see how these organizations can benefit from public data, and don't forget to contribute by sharing the data or information that matters most to your organization.
Food security at a glance
Based on your feedback, we've collected a number of statistics in Data Commons that may be helpful for food security organizations.
Food security organizations are asking these questions
How many food assistance organizations are operating in areas with high rates of poverty?
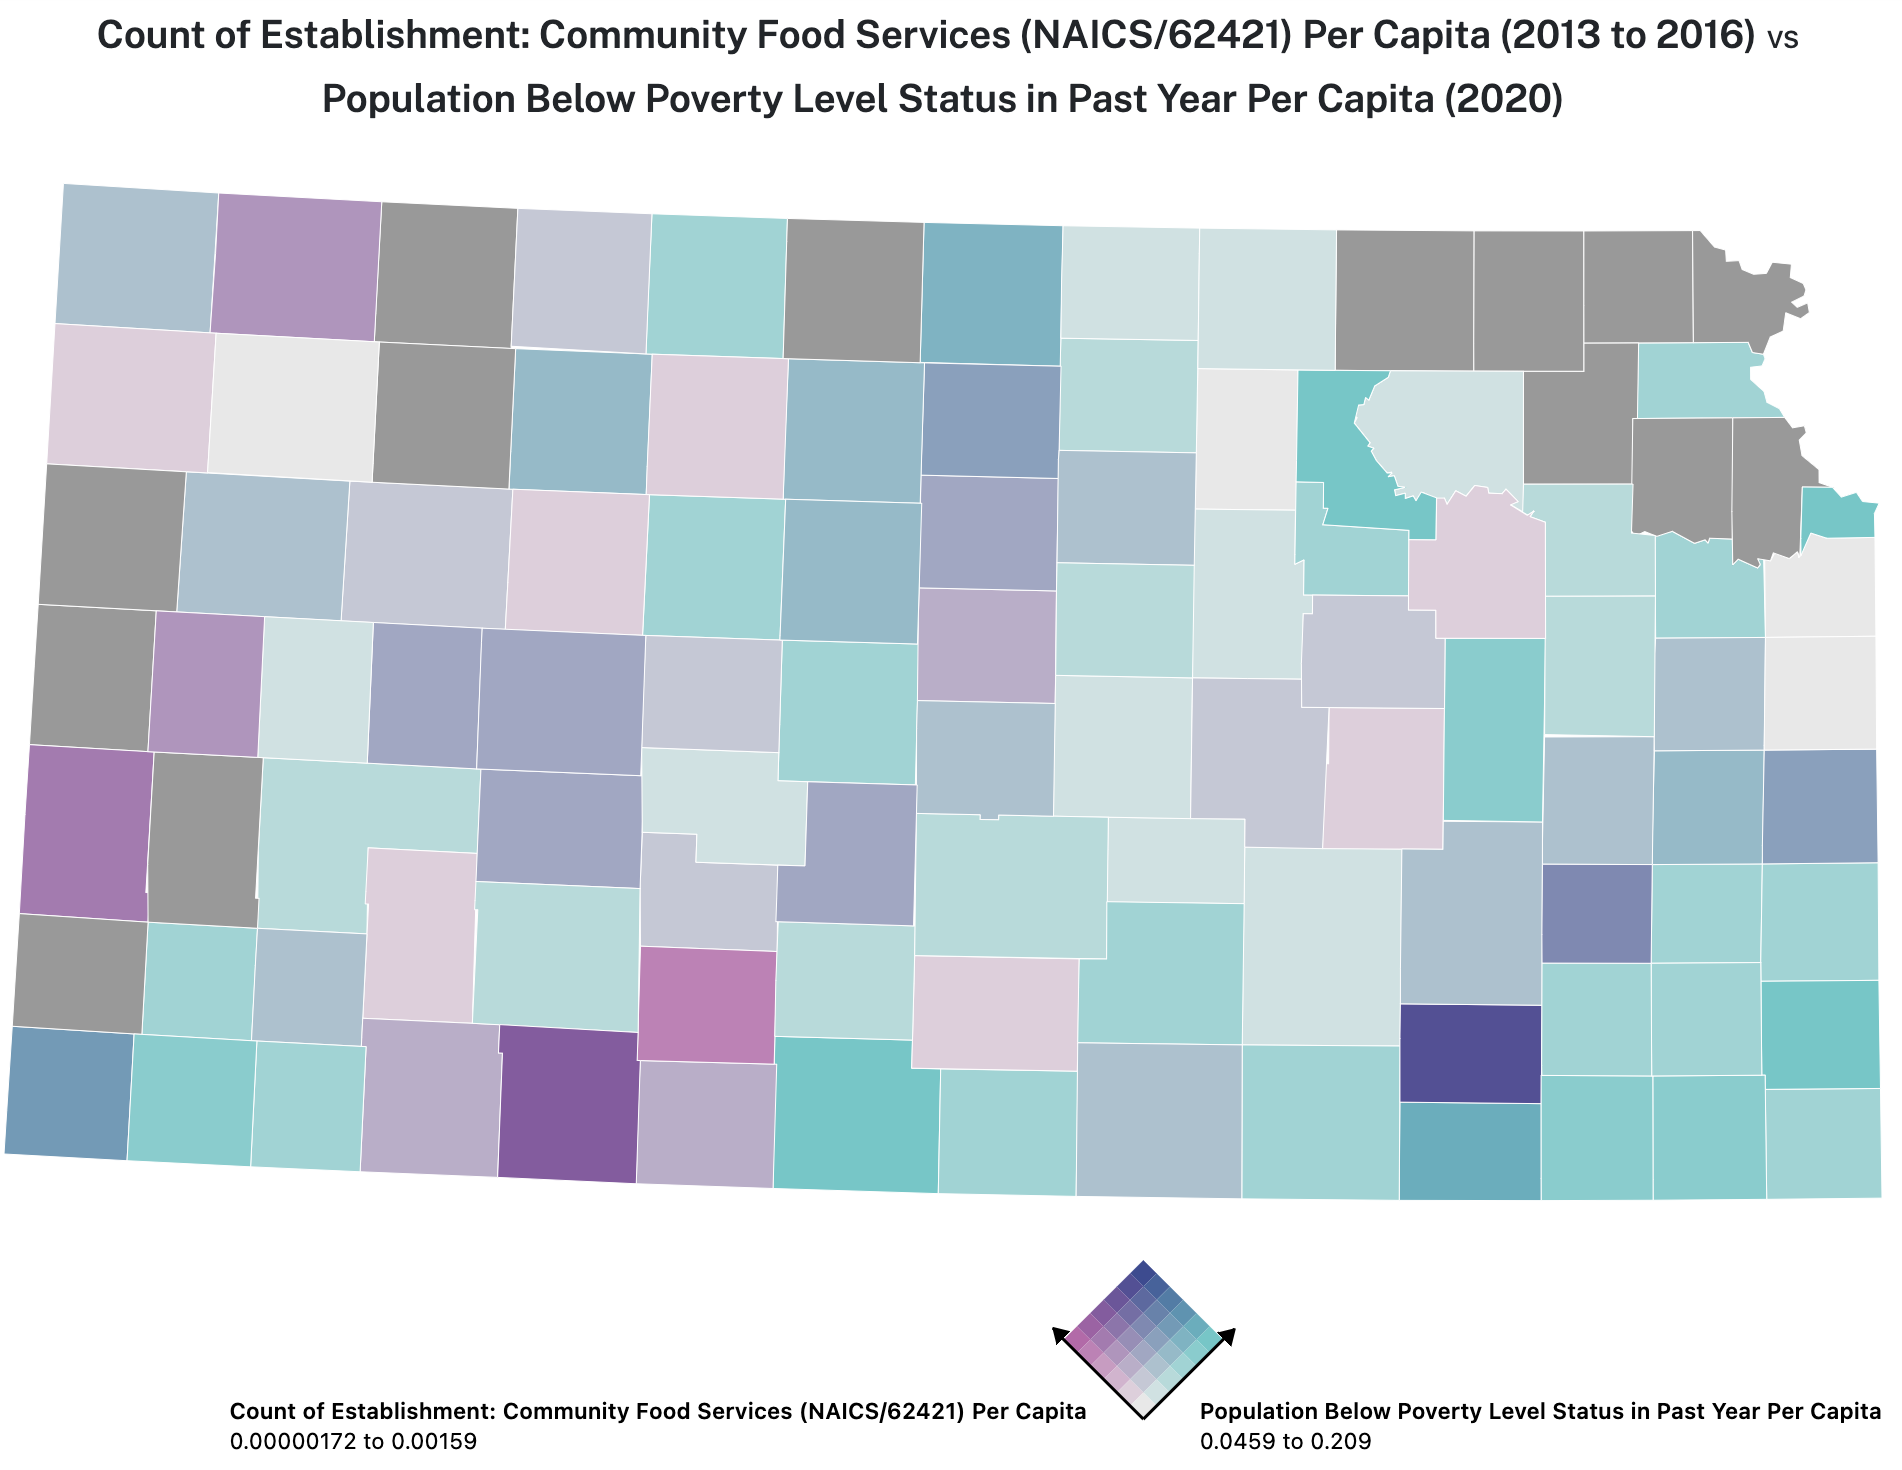 Community food services vs. Poverty in Kansas
Data that shows where food assistance organizations are located can help us visualize the geographic areas of focus for these organizations.
However, overlaying this data with geographic data about poverty rates can also help us see where there might be areas that are underserved.
Community food services vs. Poverty in Kansas
Data that shows where food assistance organizations are located can help us visualize the geographic areas of focus for these organizations.
However, overlaying this data with geographic data about poverty rates can also help us see where there might be areas that are underserved.
The map shown here uses data in Data Commons to show the per capita number of Community Food Services establishments in
each county of Kansas, combined with the per capita number of people under the poverty line.
The counties that have a more green shading are areas where there is a higher rate of poverty but a lower density of food service agencies.
Where are there large numbers of people that don't live close to grocery stores?
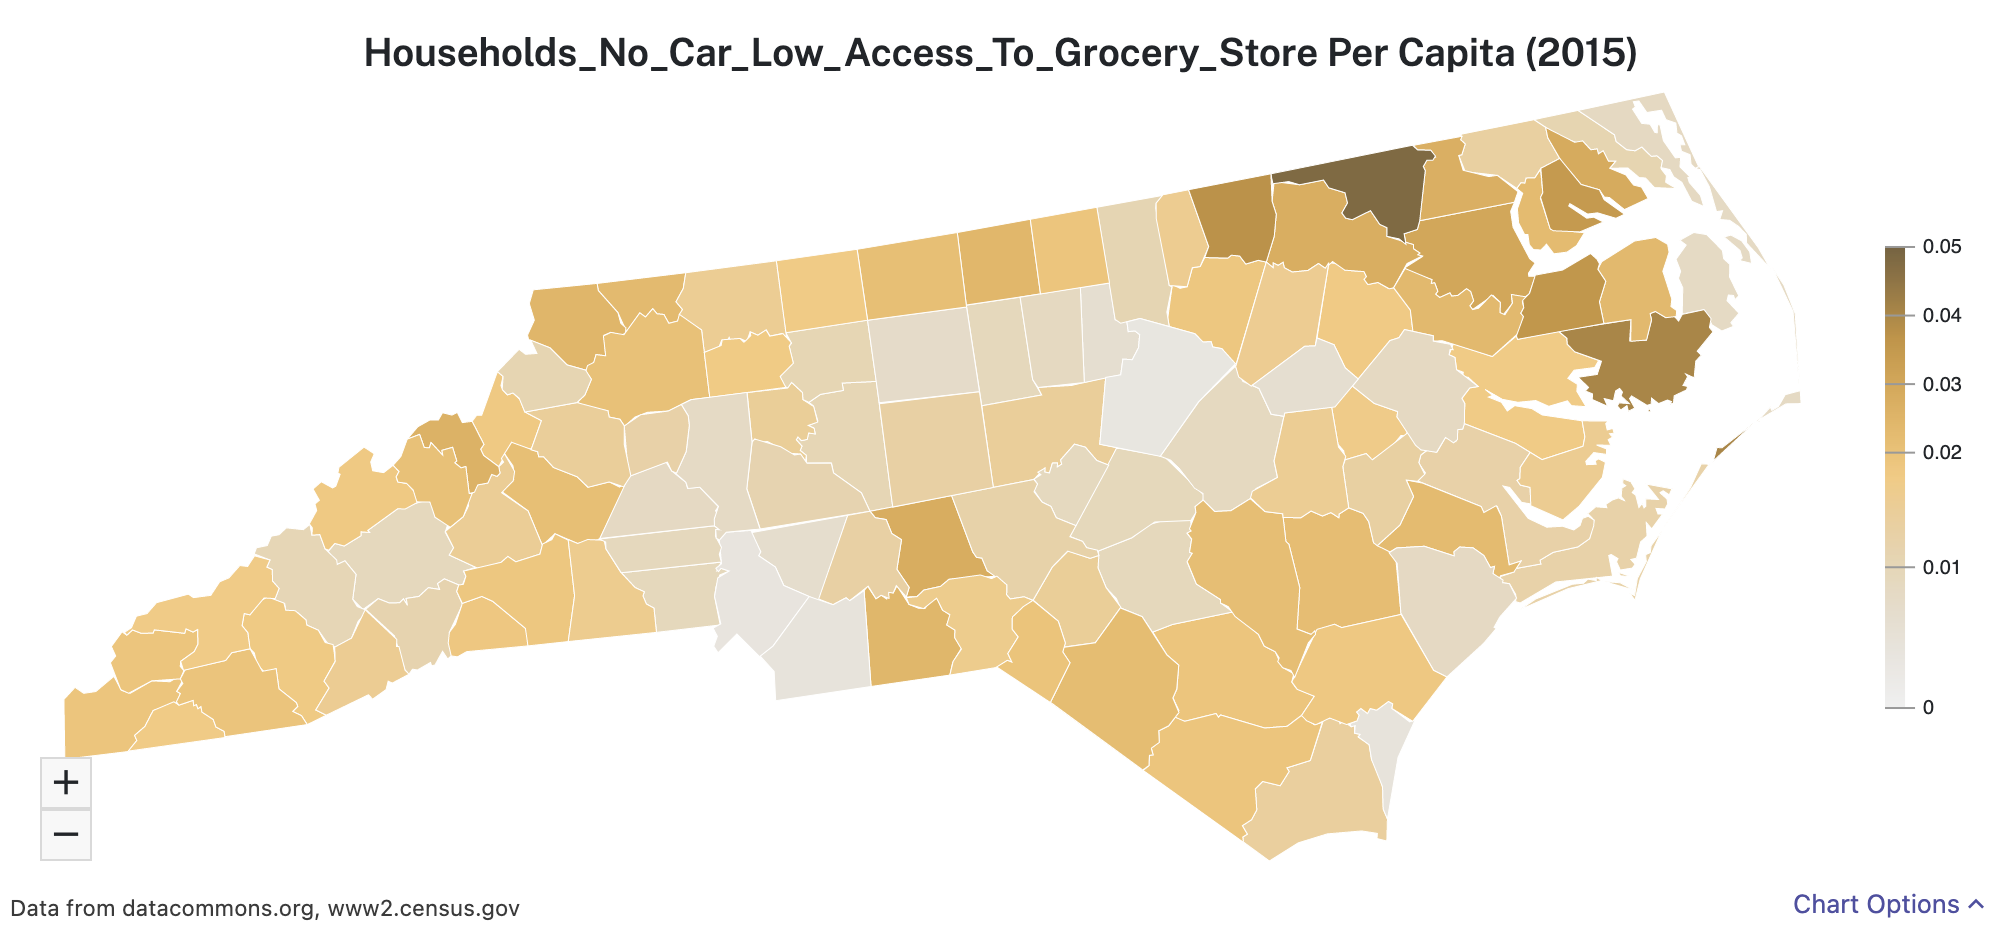 Households with no car and low access to grocery stores in N. Carolina
The distance that individuals live from supermarkets and large grocery stores affects their ability to access healthy foods. TechSoup is
adding data from the USDA's Food Environment Atlas to
Data Commons to make it easier for food security organizations to find statistics such as Access and Proximity to Grocery Stores.
Households with no car and low access to grocery stores in N. Carolina
The distance that individuals live from supermarkets and large grocery stores affects their ability to access healthy foods. TechSoup is
adding data from the USDA's Food Environment Atlas to
Data Commons to make it easier for food security organizations to find statistics such as Access and Proximity to Grocery Stores.
In this example, you can see a map of North Carolina that uses different colors to represent the per capita number of households that have no cars and are more than a mile
away from a supermarket or large grocery store. The darker colors indicate areas where there are the greatest percentage of these households.
How common are specific health issues in areas with high rates of poverty?
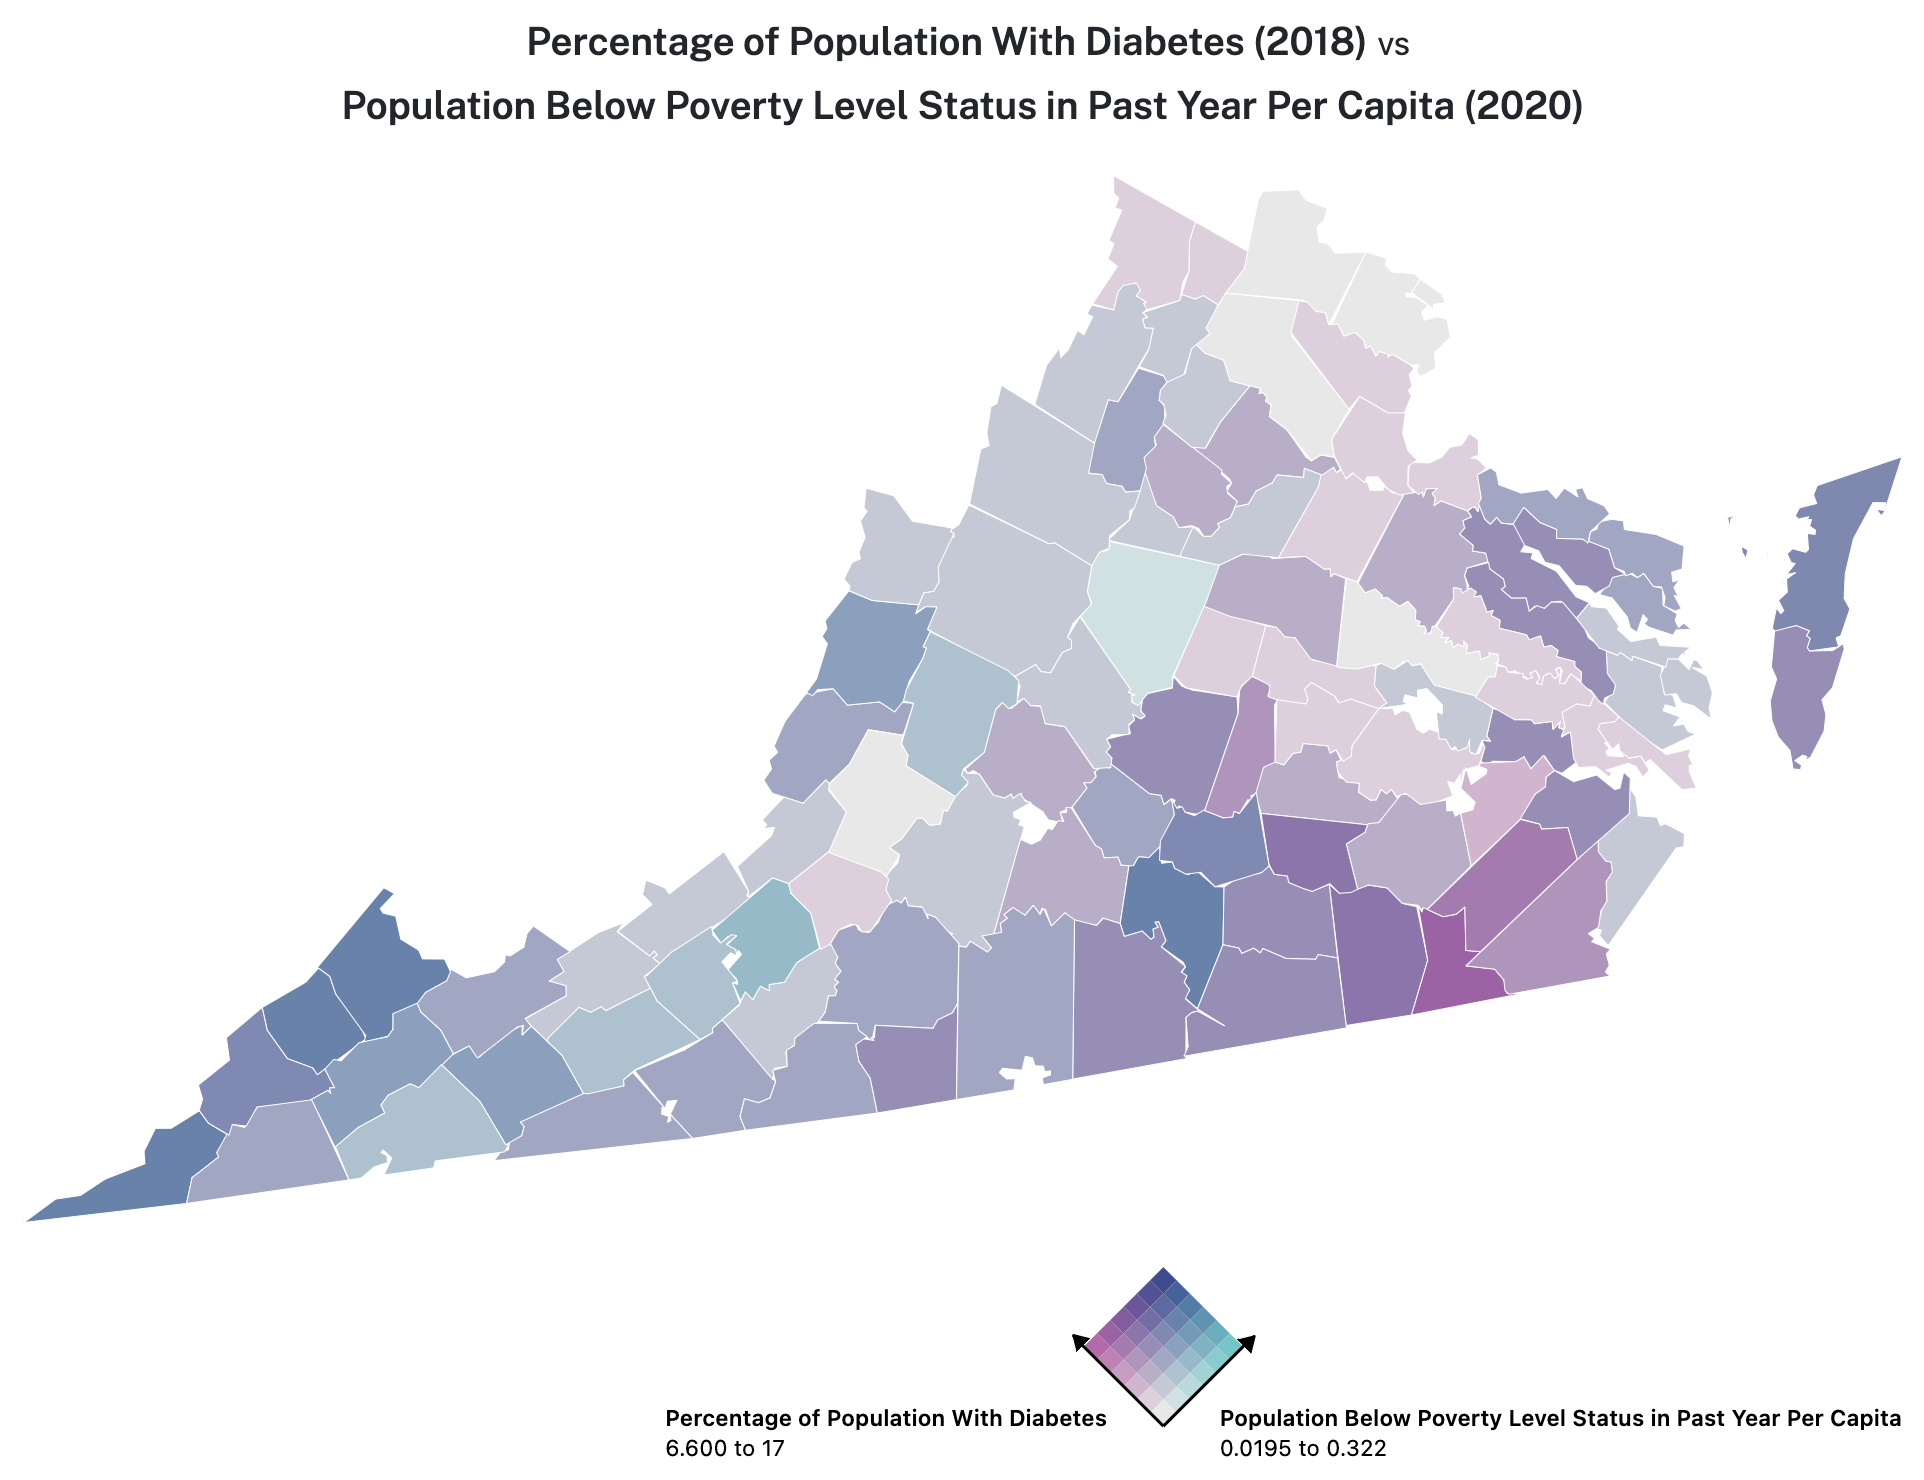 Diabetes vs. Poverty in Virginia
Food banks can best promote nutrition and health when they understand the needs of the communities to which they distribute food. Knowing about health conditions
that are common in a particular area can help them source and distribute appropriate foods for clients with these conditions.
Diabetes vs. Poverty in Virginia
Food banks can best promote nutrition and health when they understand the needs of the communities to which they distribute food. Knowing about health conditions
that are common in a particular area can help them source and distribute appropriate foods for clients with these conditions.
Data Commons has statistics from the CDC about the
prevalence of various health conditions that may be of interest to food security organizations, such as Diabetes,
Coronary Heart Disease, High Cholesterol,
High Blood Pressure
This data can be combined with geographic data about levels of poverty to
show which health conditions are likely to impact those in need of food assistance.
In this example, we have a map of Virginia that shows the per capita number of people below the poverty level in a 12 month period, and we overlayed it with
data about the per capita number of people with Diabetes. Counties on the map that have a darker blue shading are areas where food pantries and other community
partners are likely to be serving clients with Diabetes.