Climate change at a glance
Based on your feedback, we've collected a number of statistics in Data Commons that may be helpful for climate change organizations.
Climate change organizations are weighing in and sharing the information they need to bolster their reach and measure their impact. Read on to see how these organizations can benefit from public data, and don't forget to contribute by sharing the data or information that matters most to your organization.
Based on your feedback, we've collected a number of statistics in Data Commons that may be helpful for climate change organizations.
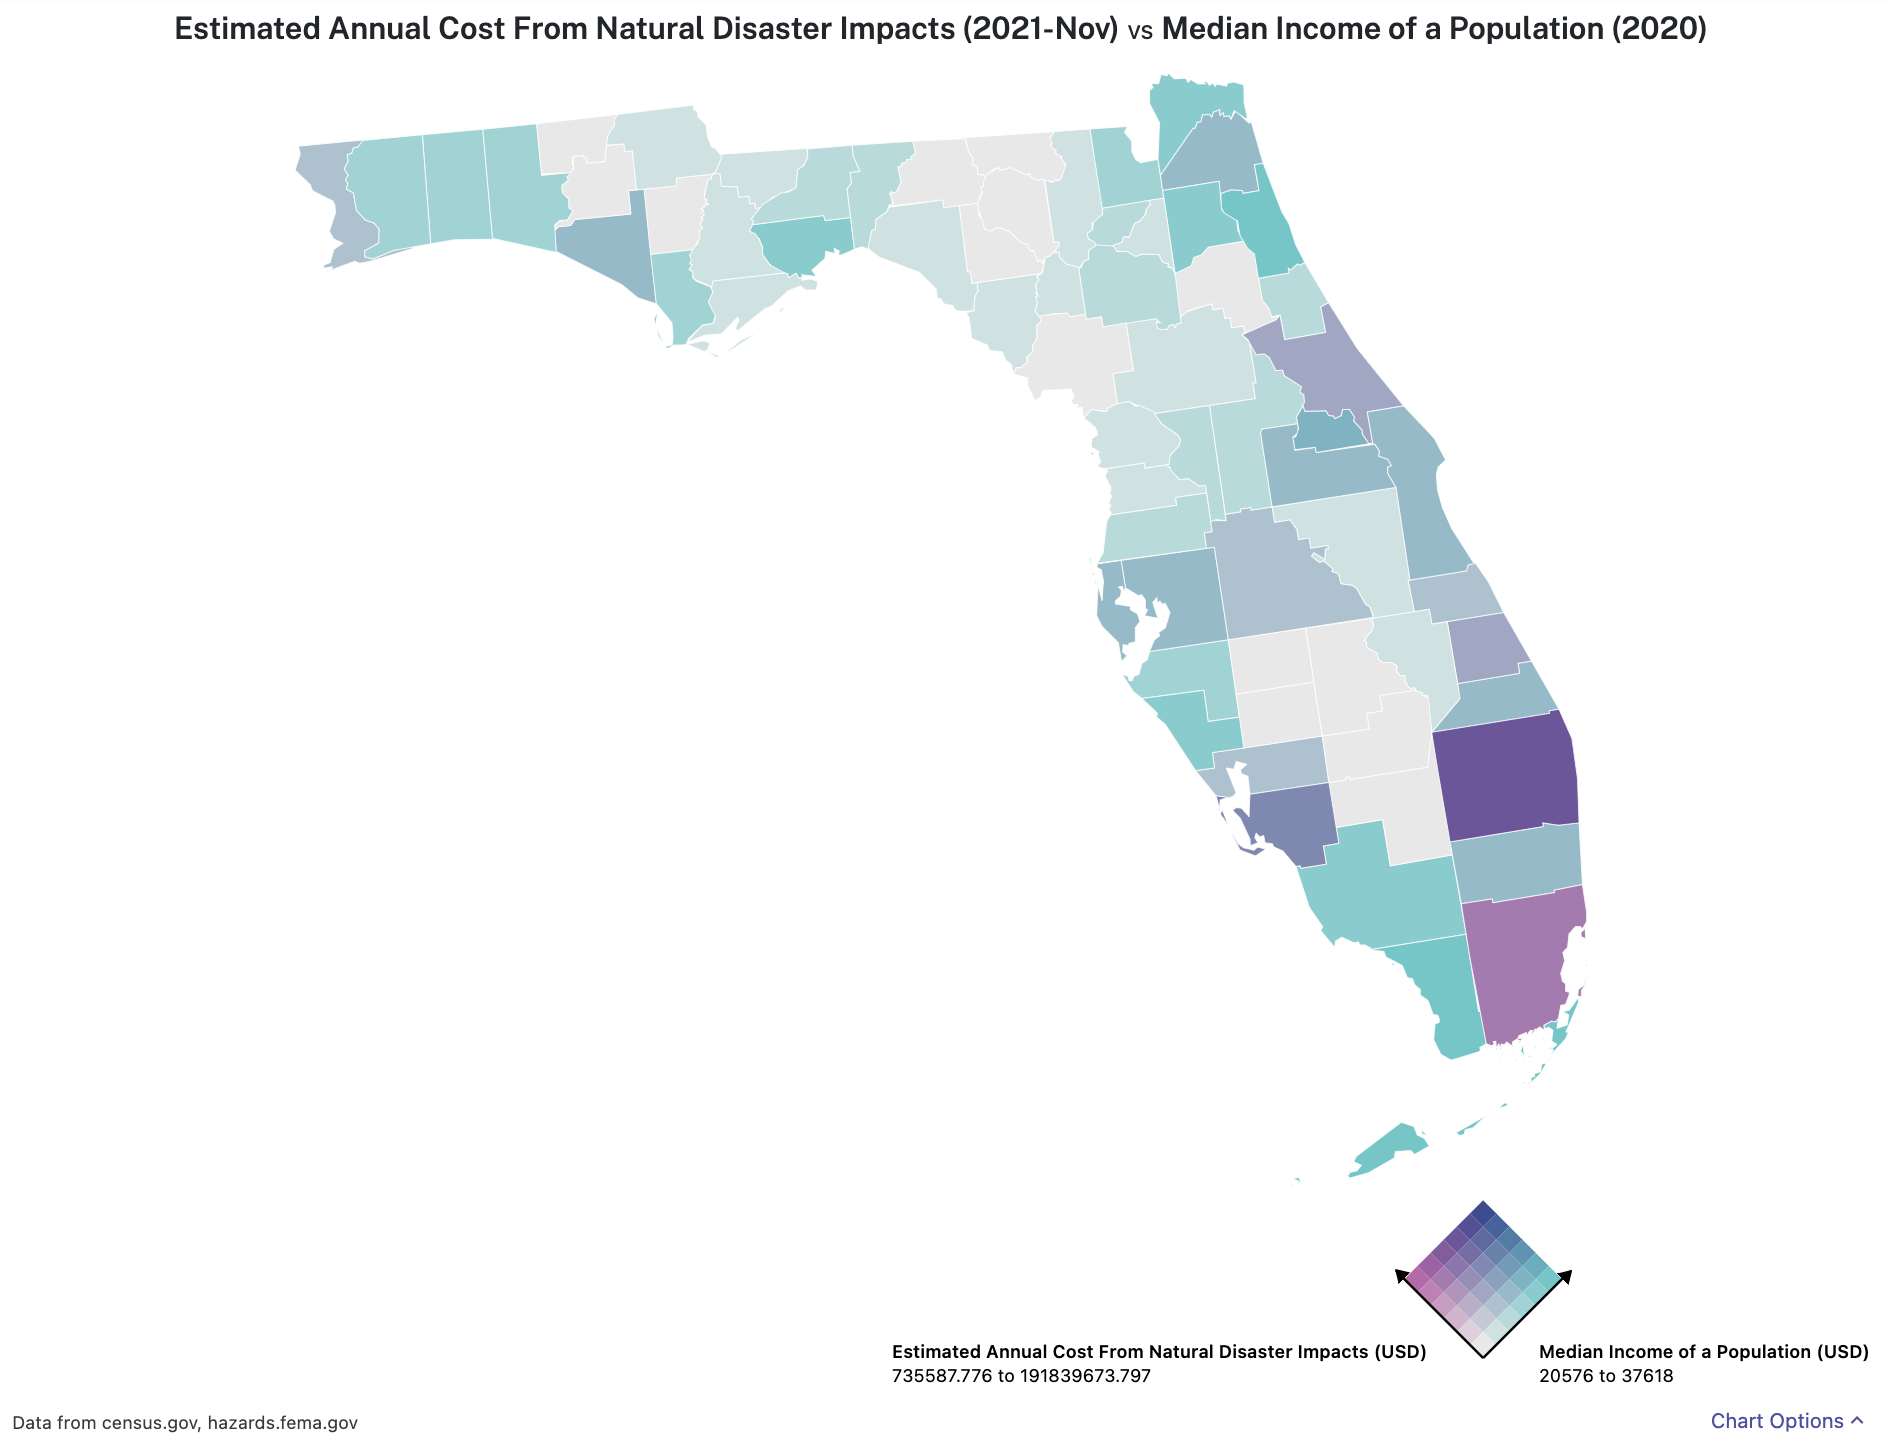 Annual costs from natural disasters vs. Median income in Florida
Climate change can be tremendously costly to manage. Governments and communities often take on significant
costs following a storm. As storms become more intense due to climate change, better resilience planning is
needed to enable communities to ‘bounce back’ after these damaging events. In places like Florida, where the
highest number of hurricanes have made landfall in the U.S., coastal resilience and adaptation efforts are
integral to preparing its communities for future storms.
Annual costs from natural disasters vs. Median income in Florida
Climate change can be tremendously costly to manage. Governments and communities often take on significant
costs following a storm. As storms become more intense due to climate change, better resilience planning is
needed to enable communities to ‘bounce back’ after these damaging events. In places like Florida, where the
highest number of hurricanes have made landfall in the U.S., coastal resilience and adaptation efforts are
integral to preparing its communities for future storms.
Data Commons allows us to create visualizations like this map of Florida. Here we’re considering the intersection of two datasets: estimated annual costs from natural disasters, and the median income of a county. Data like this allow us to consider questions like, How does socioeconomic status relate to natural disaster impacts? and enables us to dive deeper into considering which communities may be impacted by future storms.
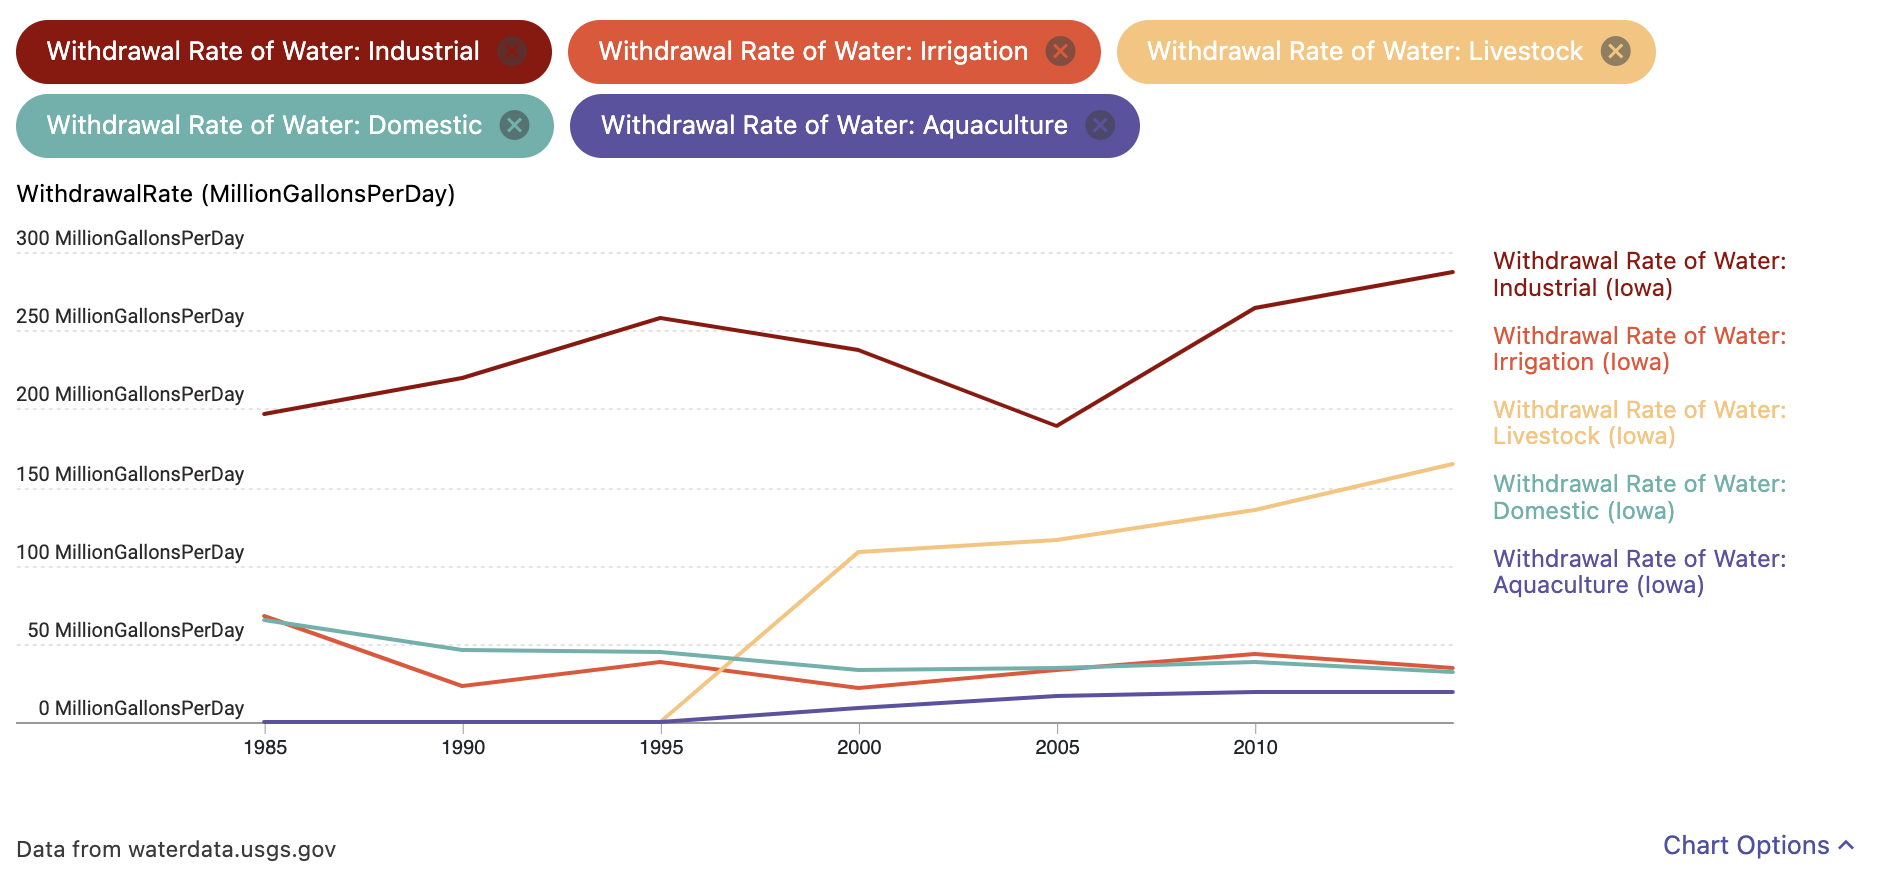 Withdrawal rates of water in Iowa
Water and climate are intimately connected, and as climate change continues to affect worldwide water
cycles, we are faced with the challenge of managing this precious resource. In the United States there is a
growing challenge of managing the rate of withdrawal from surface and groundwater reservoirs. The rapid
extraction of water from these sources, coupled with the varying rates of replenishment, can have
significant impacts on the future of water access.
Withdrawal rates of water in Iowa
Water and climate are intimately connected, and as climate change continues to affect worldwide water
cycles, we are faced with the challenge of managing this precious resource. In the United States there is a
growing challenge of managing the rate of withdrawal from surface and groundwater reservoirs. The rapid
extraction of water from these sources, coupled with the varying rates of replenishment, can have
significant impacts on the future of water access.
In Iowa, the heart of the Corn Belt, water usage and agricultural production have been closely linked and managed. Data Commons allows us to explore that relationship by visualizing different agricultural sectors' water withdrawal over time. We can also add a non-agricultural sector, like Industry, to further explore how water use has changed over time and for what purpose. This increase in industrial water withdrawal in 2005 could be linked to the growth in the biofuel industry in Iowa. Insights like these can be very useful when managing such a dynamic, and valuable resource like water.
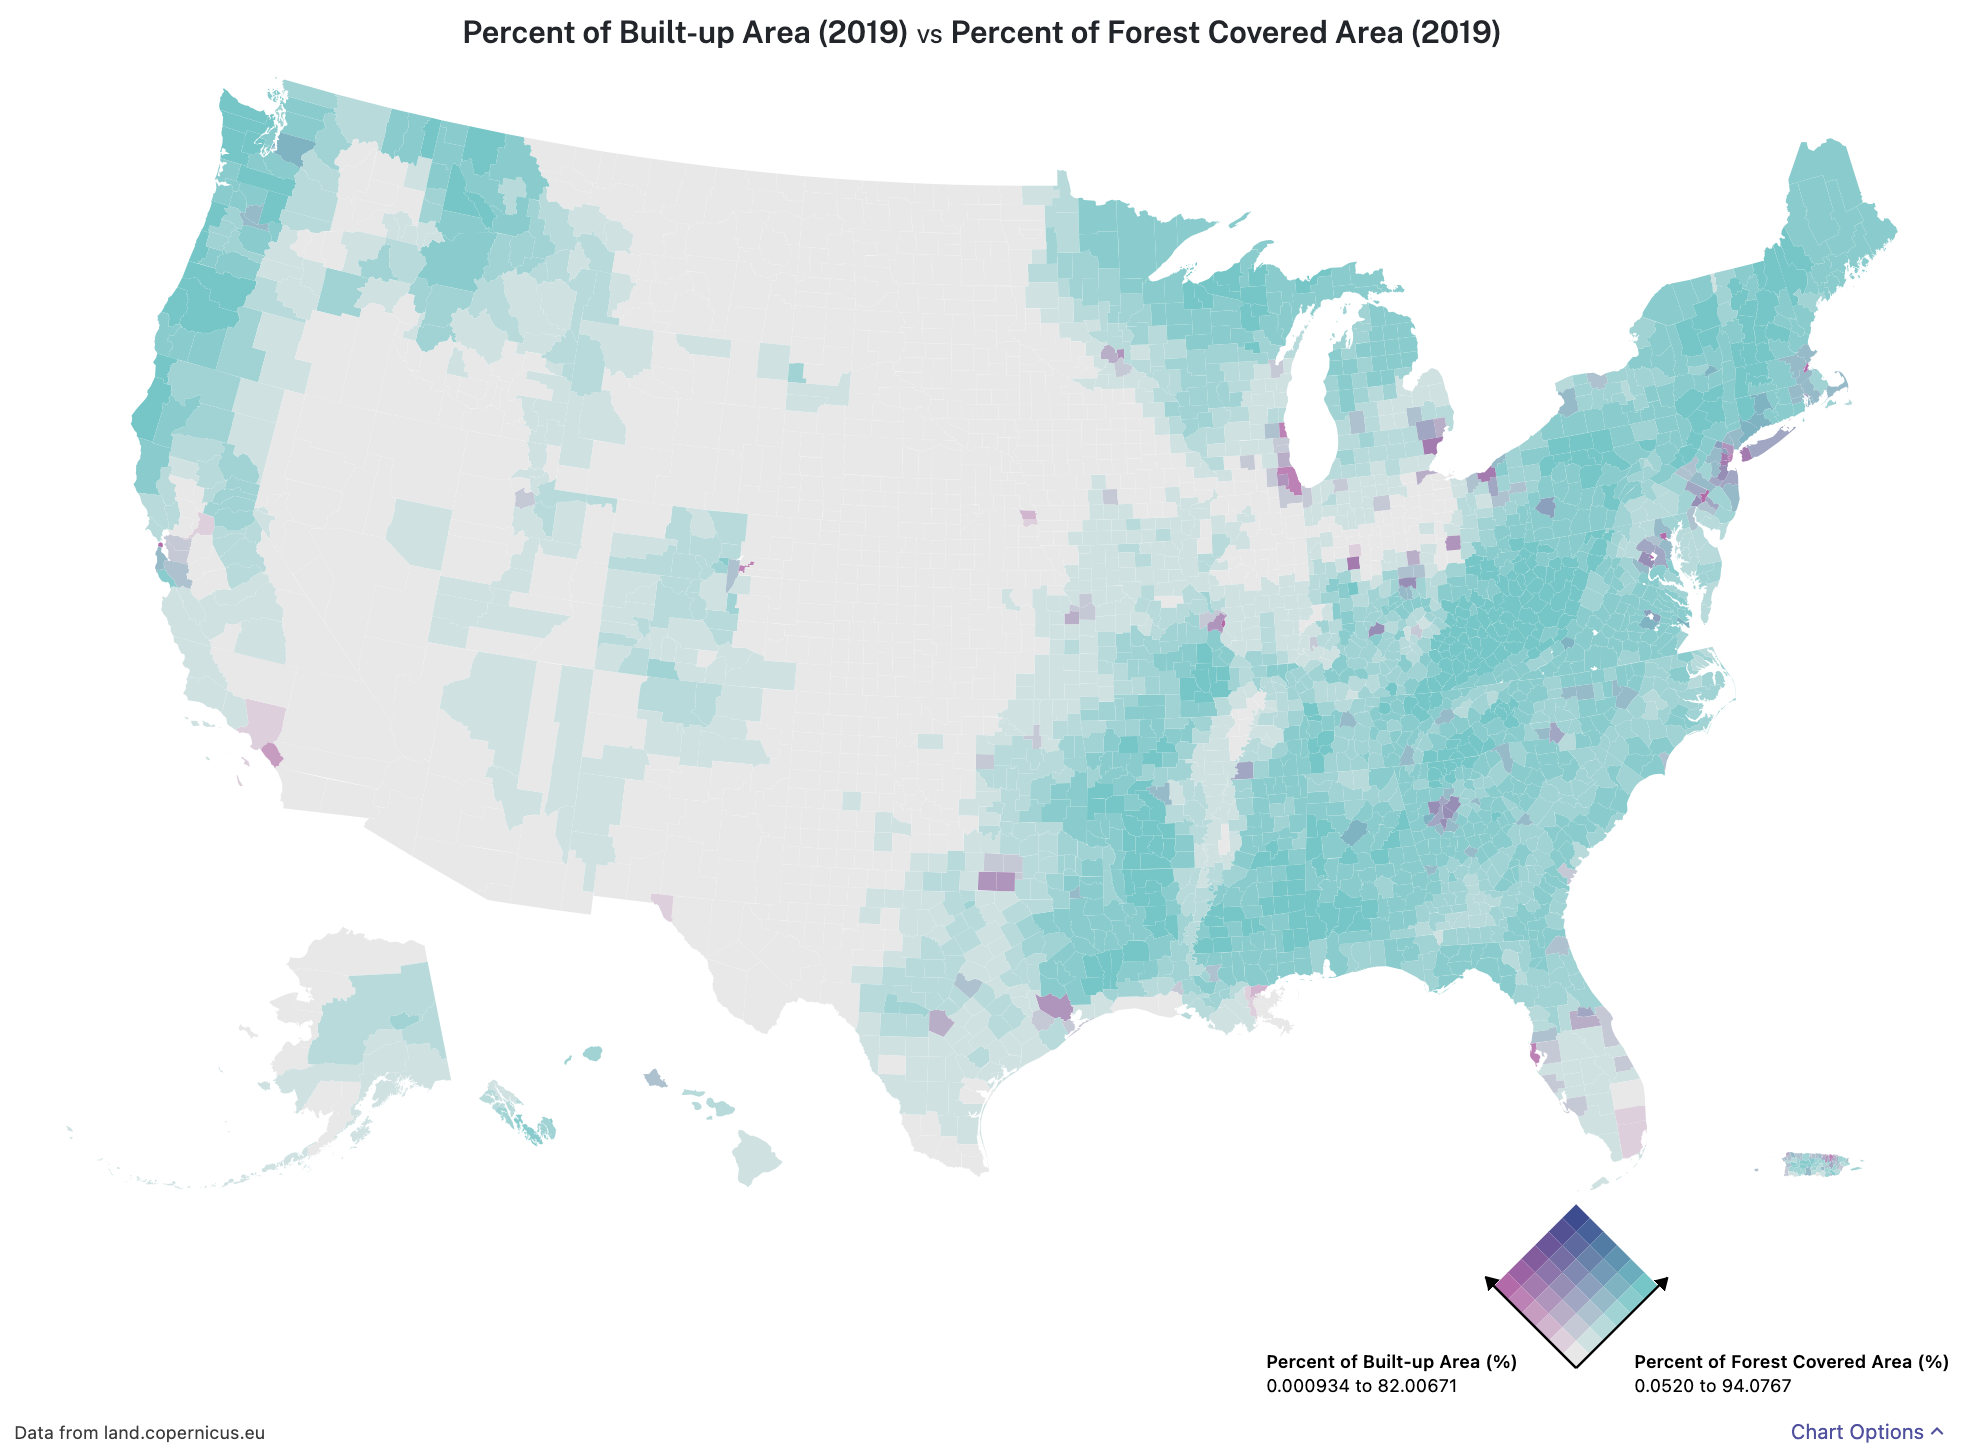 Built-up area vs. Forest-covered area in the United States
Forests play a key role in managing the amount of carbon in our atmosphere. As trees grow they store carbon
in their biomass, reducing the amount of atmospheric carbon. Forests also provide a range of ecological
services like biological habitat, water filtration, soil erosion prevention, and recreation. As humans
create settlements, we inevitably alter the landscapes that come in contact with our development.
Built-up area vs. Forest-covered area in the United States
Forests play a key role in managing the amount of carbon in our atmosphere. As trees grow they store carbon
in their biomass, reducing the amount of atmospheric carbon. Forests also provide a range of ecological
services like biological habitat, water filtration, soil erosion prevention, and recreation. As humans
create settlements, we inevitably alter the landscapes that come in contact with our development.
Tracking land use over time can be highly useful in managing resources like the forests. This data, hosted by Data Commons, allows us to compare the proportion of built-up area to forest-covered area in 2019. Maps like this provide the opportunity to consider our growing relationship with our landscapes and can enable better planning practices for the future.